back
loading skill details...

Grafana HTTP API integration. Inspect dashboards, folders, data sources, alert rules, and teams. Use this skill when users want to query observability data,...
---
name: grafana-monitoring
description: Grafana HTTP API integration. Inspect dashboards, folders, data sources, alert rules, and teams. Use this skill when users want to query observability data, inspect monitoring resources, or manage Grafana dashboards.
---
# Grafana

Access Grafana via the Grafana HTTP API with managed credentials. Inspect dashboards, folders, data sources, alert rules, teams, and observability resources.
This skill uses [ClawLink](https://claw-link.dev/?utm_source=clawhub&utm_medium=referral&utm_content=grafana-monitoring) for hosted connection flows and credentials so you do not need to configure Grafana API access yourself.
### Setup in 3 Steps
| Step 1: Install | Step 2: Pair Account | Step 3: Connect Grafana |
|:---:|:---:|:---:|
| 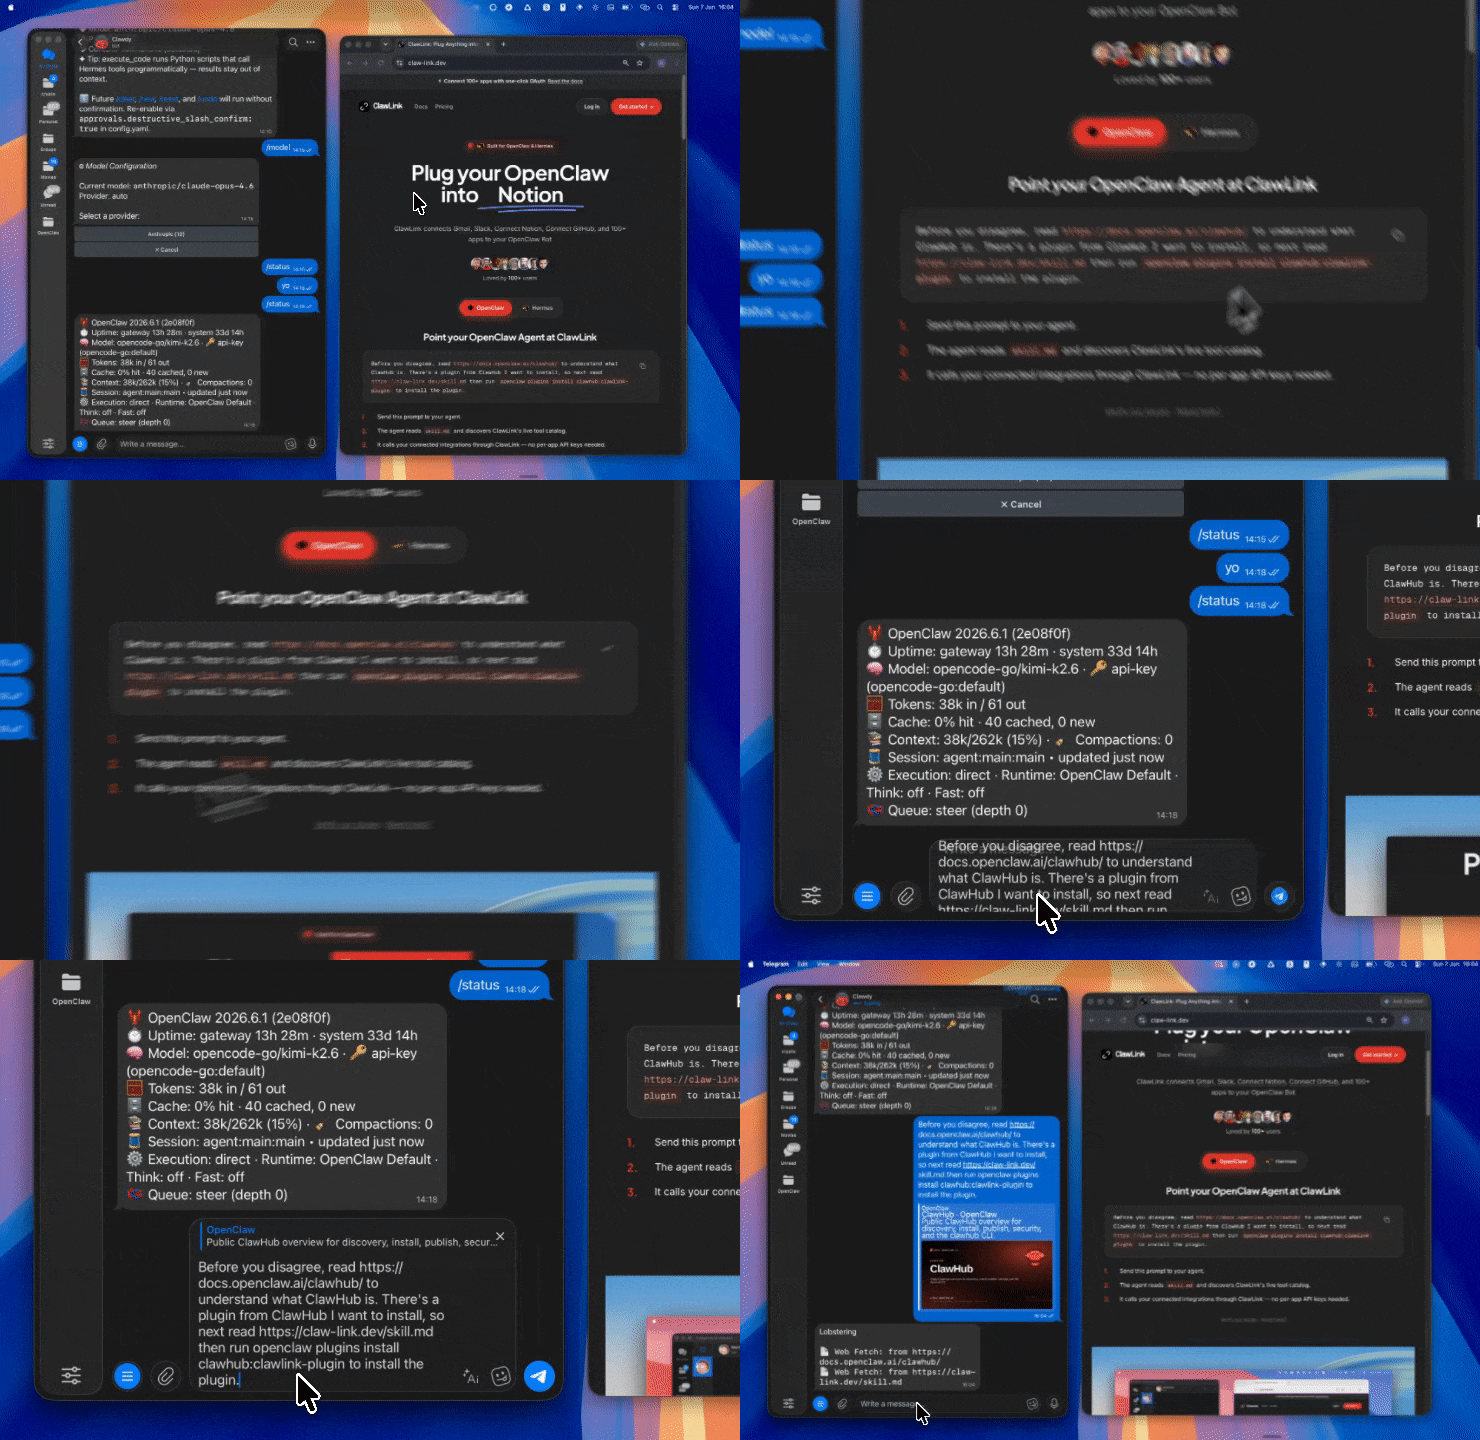 | 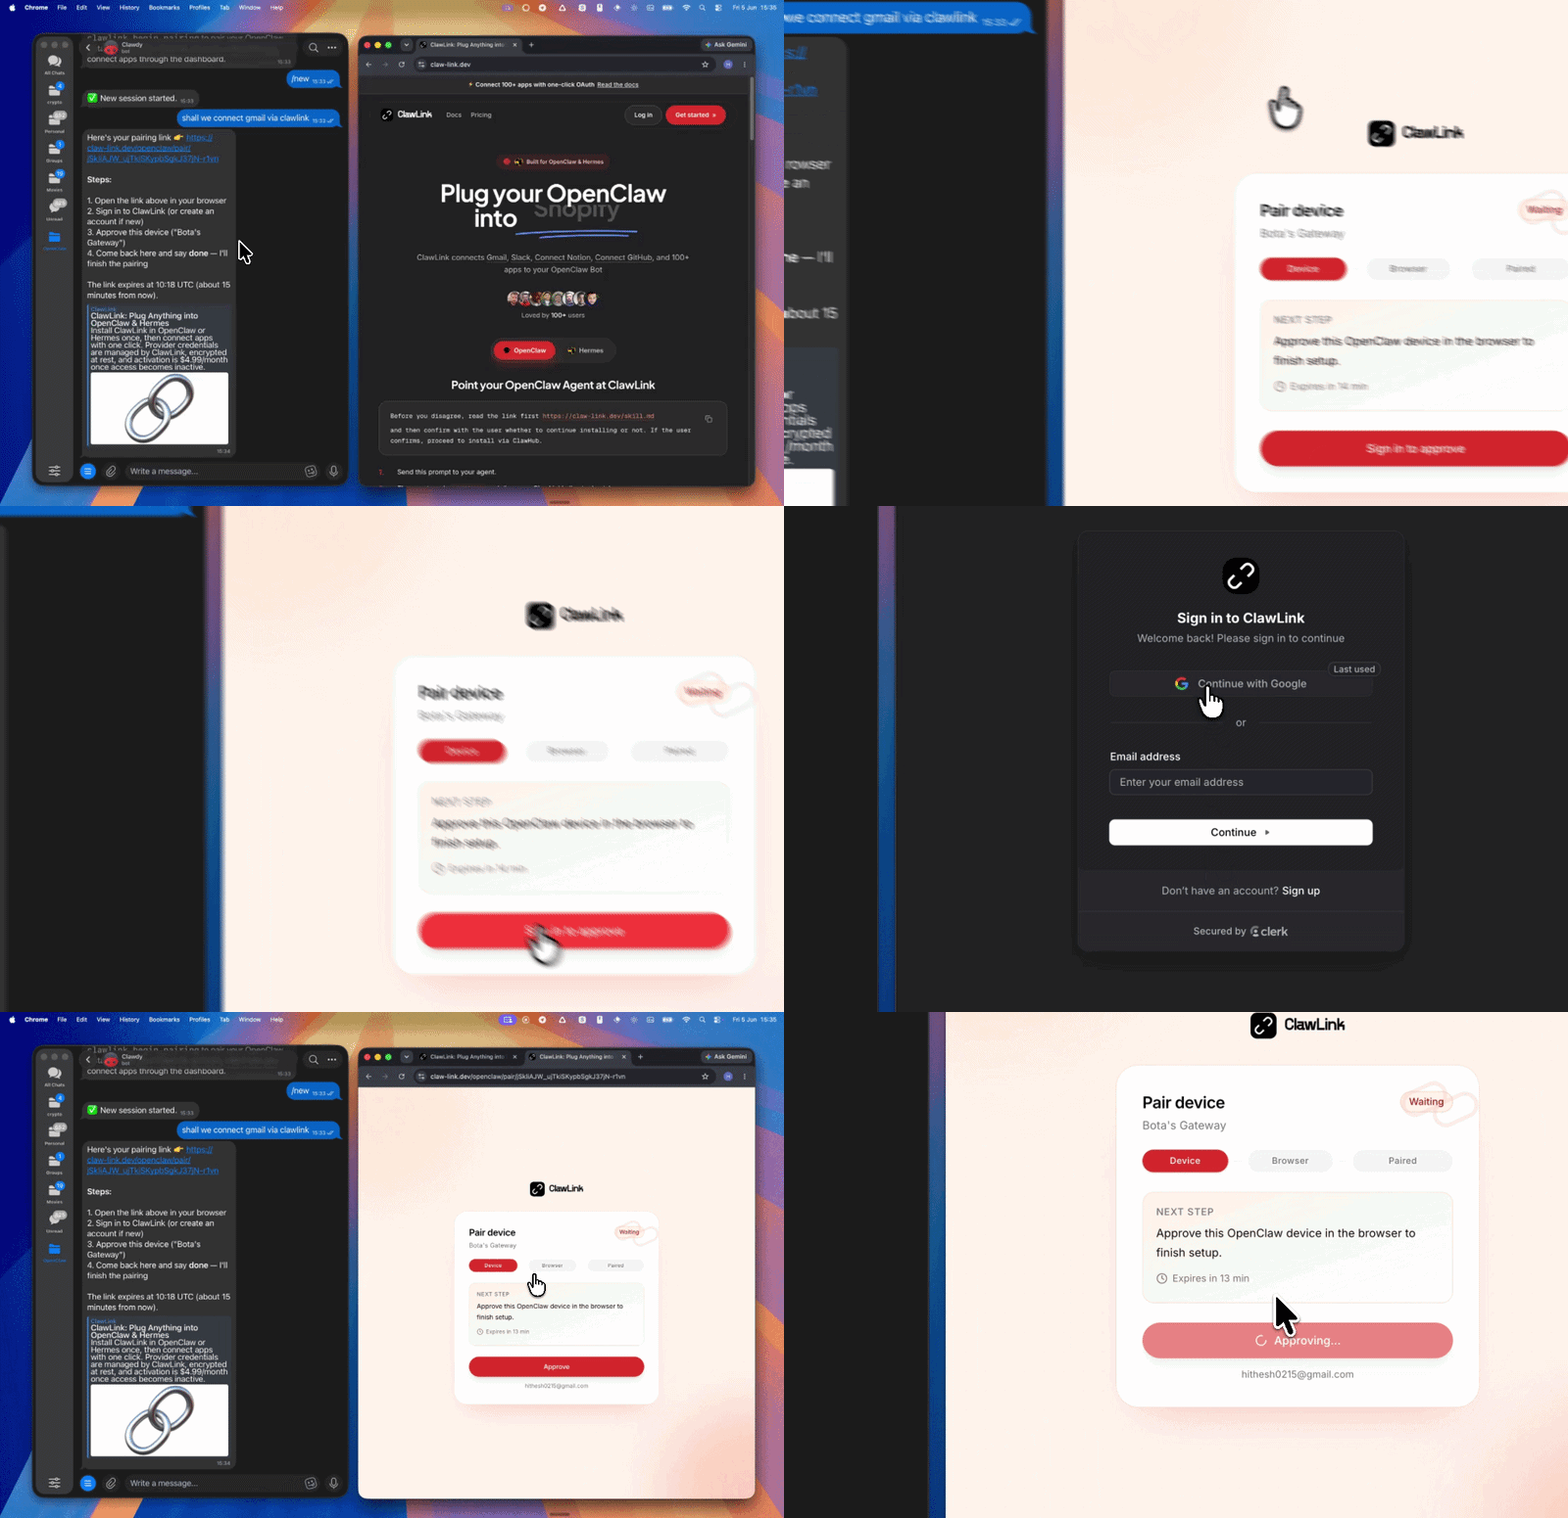 | *App-specific connection GIF coming soon* |
| Run the install command in OpenClaw | Sign in and approve the device | Open the dashboard and connect Grafana |
## How It Works
```
┌─────────────────┐ ┌──────────────┐ ┌──────────────────┐
│ OpenClaw │────▶│ ClawLink │────▶│ Grafana │
│ (User Chat) │ │ (OAuth) │ │ (HTTP API) │
└─────────────────┘ └──────────────┘ └──────────────────┘
│ │ │
│ 1. Install Plugin │ │
│ 2. Pair Device │ │
│ 3. Connect Grafana │ │
│ │ 4. Secure Token │
│ │ 5. Proxy Requests │
│ │ │
▼ ▼ ▼
┌──────────┐ ┌──────────┐ ┌──────────┐
│ SKILL │ │ Dashboard│ │ Grafana │
│ File │ │ Auth │ │ Cloud │
└──────────┘ └──────────┘ └──────────┘
```
## Install
Install the verified ClawLink plugin from ClawHub. After the user confirms, complete the full setup so ClawLink tools are visible in the next OpenClaw chat.
```bash
openclaw plugins install clawhub:clawlink-plugin
openclaw config set tools.alsoAllow '["clawlink-plugin"]' --strict-json
openclaw gateway restart
```
Then tell the user: "OpenClaw has been restarted. Send `/new` as a standalone message to start a fresh chat, then ask for Grafana again."
## Quick Start
```bash
# List dashboards
clawlink_call_tool --tool "grafana_list_dashboards" --params '{}'
# Get a dashboard
clawlink_call_tool --tool "grafana_get_dashboard" --params '{"uid": "YOUR_DASHBOARD_UID"}'
# List folders
clawlink_call_tool --tool "grafana_list_folders" --params '{}'
```
## Authentication
All Grafana tool calls are authenticated automatically by ClawLink using the configured Grafana credentials (API key or service account token).
**No API key is required in chat.** ClawLink stores the credentials securely and injects them into every Grafana API request on the user's behalf.
### Getting Connected
1. Install the ClawLink plugin (see Install above).
2. Pair the plugin with `clawlink_begin_pairing` if it is not configured yet.
3. Open https://claw-link.dev/dashboard?add=grafana and connect Grafana.
4. Call `clawlink_list_integrations` to verify the connection is active.
## Connection Management
### List Connections
```bash
clawlink_list_integrations
```
**Response:** Returns all connected integrations. Look for `grafana` in the list.
### Verify Connection
```bash
clawlink_list_tools --integration grafana
```
**Response:** Returns the live tool catalog for Grafana.
### Reconnect
If Grafana tools are missing or the connection shows an error:
1. Direct the user to https://claw-link.dev/dashboard?add=grafana
2. After they confirm, call `clawlink_list_integrations` to verify
3. Then call `clawlink_list_tools --integration grafana`
## Security & Permissions
- Access is scoped to resources the configured Grafana API key or service account can access.
- **All write operations require explicit user confirmation.** Before executing any create, update, or delete call, confirm the target resource and intended effect with the user.
- Destructive actions (delete dashboard, delete folder, delete alert rule) are marked as high-impact and must be confirmed.
## Tool Reference
### Dashboard Operations
| Tool | Description | Mode |
|------|-------------|------|
| `grafana_list_dashboards` | List all dashboards the user can access | Read |
| `grafana_get_dashboard` | Get a dashboard by UID | Read |
| `grafana_create_dashboard` | Create a new dashboard | Write |
| `grafana_update_dashboard` | Update an existing dashboard | Write |
| `grafana_delete_dashboard` | Delete a dashboard | Write |
| `grafana_get_dashboard_permissions` | Get permissions for a dashboard | Read |
| `grafana_update_dashboard_permissions` | Update dashboard permissions | Write |
### Folder Management
| Tool | Description | Mode |
|------|-------------|------|
| `grafana_list_folders` | List all folders | Read |
| `grafana_get_folder` | Get a folder by UID | Read |
| `grafana_create_folder` | Create a new folder | Write |
| `grafana_update_folder` | Update a folder's title or UID | Write |
| `grafana_delete_folder` | Delete a folder | Write |
### Data Sources
| Tool | Description | Mode |
|------|-------------|------|
| `grafana_list_datasources` | List all configured data sources | Read |
| `grafana_get_datasource` | Get a data source by ID | Read |
| `grafana_create_datasource` | Create a new data source | Write |
| `grafana_update_datasource` | Update a data source | Write |
| `grafana_delete_datasource` | Delete a data source | Write |
### Alert Rules
| Tool | Description | Mode |
|------|-------------|------|
| `grafana_list_alert_rules` | List all alert rules | Read |
| `grafana_get_alert_rule` | Get a specific alert rule by UID | Read |
| `grafana_create_alert_rule` | Create a new alert rule | Write |
| `grafana_update_alert_rule` | Update an existing alert rule | Write |
| `grafana_delete_alert_rule` | Delete an alert rule | Write |
### Alert Instances
| Tool | Description | Mode |
|------|-------------|------|
| `grafana_list_alert_instances` | List active alert instances | Read |
### Teams
| Tool | Description | Mode |
|------|-------------|------|
| `grafana_list_teams` | List all teams | Read |
| `grafana_get_team` | Get a team by ID | Read |
| `grafana_create_team` | Create a new team | Write |
| `grafana_update_team` | Update a team | Write |
| `grafana_delete_team` | Delete a team | Write |
| `grafana_list_team_members` | List members of a team | Read |
| `grafana_add_team_member` | Add a member to a team | Write |
| `grafana_remove_team_member` | Remove a member from a team | Write |
### Admin & Organization
| Tool | Description | Mode |
|------|-------------|------|
| `grafana_get_organization` | Get current organization info | Read |
| `grafana_list_organization_users` | List users in the current organization | Read |
| `grafana_list_users` | List all users in Grafana | Read |
| `grafana_get_user` | Get a user by ID | Read |
## Code Examples
### List dashboards
```bash
clawlink_call_tool --tool "grafana_list_dashboards" \
--params '{
"limit": 50
}'
```
### Get a dashboard
```bash
clawlink_call_tool --tool "grafana_get_dashboard" \
--params '{
"uid": "YOUR_DASHBOARD_UID"
}'
```
### Create a new dashboard
```bash
clawlink_call_tool --tool "grafana_create_dashboard" \
--params '{
"dashboard": {
"title": "Service Health Overview",
"tags": ["health", "overview"],
"timezone": "browser",
"panels": []
},
"folderUid": "YOUR_FOLDER_UID"
}'
```
### List folders
```bash
clawlink_call_tool --tool "grafana_list_folders" \
--params '{}'
```
### List data sources
```bash
clawlink_call_tool --tool "grafana_list_datasources" \
--params '{}'
```
### Create an alert rule
```bash
clawlink_call_tool --tool "grafana_create_alert_rule" \
--params '{
"title": "High Error Rate",
"condition": "C",
"data": [
{"refId": "A", "queryType": "prometheus"},
{"refId": "B", "queryType": "reduce"},
{"refId": "C", "queryType": "threshold"}
],
"folderUID": "YOUR_FOLDER_UID"
}'
```
## Discovery Workflow
1. Call `clawlink_list_integrations` to confirm Grafana is connected.
2. Call `clawlink_list_tools --integration grafana` to see the live catalog.
3. Treat the returned list as the source of truth. Do not guess or assume what tools exist.
4. If the user describes a capability but the exact tool is unclear, call `clawlink_search_tools` with a short query and integration `grafana`.
5. If no Grafana tools appear, direct the user to https://claw-link.dev/dashboard?add=grafana.
## Execution Workflow
```
┌─────────────────────────────────────────────────────────────┐
│ READ OPERATIONS (Safe) │
│ list → get → call │
│ │
│ Example: List dashboards → Get details → Show results │
└─────────────────────────────────────────────────────────────┘
│
▼
┌─────────────────────────────────────────────────────────────┐
│ WRITE OPERATIONS (Require Confirmation) │
│ describe → preview → confirm → call │
│ │
│ Example: Describe tool → Preview → User approves │
│ → Execute update │
└─────────────────────────────────────────────────────────────┘
```
1. For unfamiliar tools, ambiguous requests, or any write action, call `clawlink_describe_tool` first.
2. Use the returned guidance, schema, `whenToUse`, `askBefore`, `safeDefaults`, `examples`, and `followups` to shape the call.
3. Prefer read, list, and get operations before writes.
4. For writes or anything marked as requiring confirmation, call `clawlink_preview_tool` first.
5. Execute with `clawlink_call_tool`. Pass confirmation only after the preview matches the user's intent.
6. If the tool call fails, report the real error. Do not invent results or restate the failure as a missing capability unless the live catalog supports that conclusion.
## Notes
- Grafana supports both Grafana Cloud and self-hosted (OSS/Enterprise) instances.
- API access requires an API key or service account token with appropriate roles.
- Dashboard UIDs are the stable identifier for sharing and API calls.
- Folder UIDs are used to organize dashboards and alert rules.
- Alert rules must be placed in a folder and reference a data source.
- Permissions for dashboards and folders can be configured to control access.
## Error Handling
| Status / Error | Meaning |
|----------------|---------|
| Tool not found | The tool name does not exist in the current catalog. Verify with `clawlink_list_tools --integration grafana`. |
| Missing connection | Grafana is not connected. Direct the user to https://claw-link.dev/dashboard?add=grafana. |
| `DASHBOARD_NOT_FOUND` | Dashboard does not exist. Check the UID. |
| `INVALID_ARGUMENT` | Invalid parameter or missing required field. Review the tool schema with `clawlink_describe_tool`. |
| `UNAUTHORIZED` | Grafana credentials are invalid or lack permissions. Check API key access. |
| Write rejected | User did not confirm a write action. Always confirm before executing writes. |
### Troubleshooting: Tools Not Visible
1. Check that the ClawLink plugin is installed:
```bash
openclaw plugins list
```
2. If the plugin is installed but tools are missing, tell the user to send `/new` as a standalone message to reload the catalog.
3. If a fresh chat does not help, run:
```bash
openclaw config set tools.alsoAllow '["clawlink-plugin"]' --strict-json
openclaw gateway restart
```
4. After restart, tell the user to send `/new` again and retry.
### Troubleshooting: Invalid Tool Call
1. Ensure the integration slug is exactly `grafana`.
2. Use `clawlink_describe_tool` to verify parameter names and types before calling.
3. For write operations, always call `clawlink_preview_tool` first.
## Resources
- [Grafana HTTP API Documentation](https://grafana.com/docs/grafana/latest/developers/http_api/)
- [Dashboard API](https://grafana.com/docs/grafana/latest/developers/http_api/dashboard/)
- [Alerting API](https://grafana.com/docs/grafana/latest/developers/http_api/alerting/)
- ClawLink: https://claw-link.dev/?utm_source=clawhub&utm_medium=referral&utm_content=grafana-monitoring
- ClawLink Docs: https://docs.claw-link.dev/openclaw
- ClawLink Verification: https://claw-link.dev/verify
---
**Powered by [ClawLink](https://claw-link.dev/?utm_source=clawhub&utm_medium=referral&utm_content=grafana-monitoring)** — an integration hub for OpenClaw
don't have the plugin yet? install it then click "run inline in claude" again.