back
loading skill details...

Inspect Datadog monitors, metrics, logs, incidents, dashboards, and observability data - powered by ClawLink.
---
name: datadog-monitoring
description: Inspect Datadog monitors, metrics, logs, incidents, dashboards, and observability data - powered by ClawLink.
---
# Datadog

Work with Datadog from chat - inspect monitors, metrics, logs, incidents, dashboards, and observability data.
Powered by [ClawLink](https://claw-link.dev/?utm_source=clawhub&utm_medium=referral&utm_content=datadog-monitoring), an integration hub for OpenClaw that handles hosted connection flows and credentials so you don't need to configure Datadog API access yourself.
### Setup in 3 Steps
| Step 1: Install | Step 2: Pair Account | Step 3: Connect Datadog |
|:---:|:---:|:---:|
| 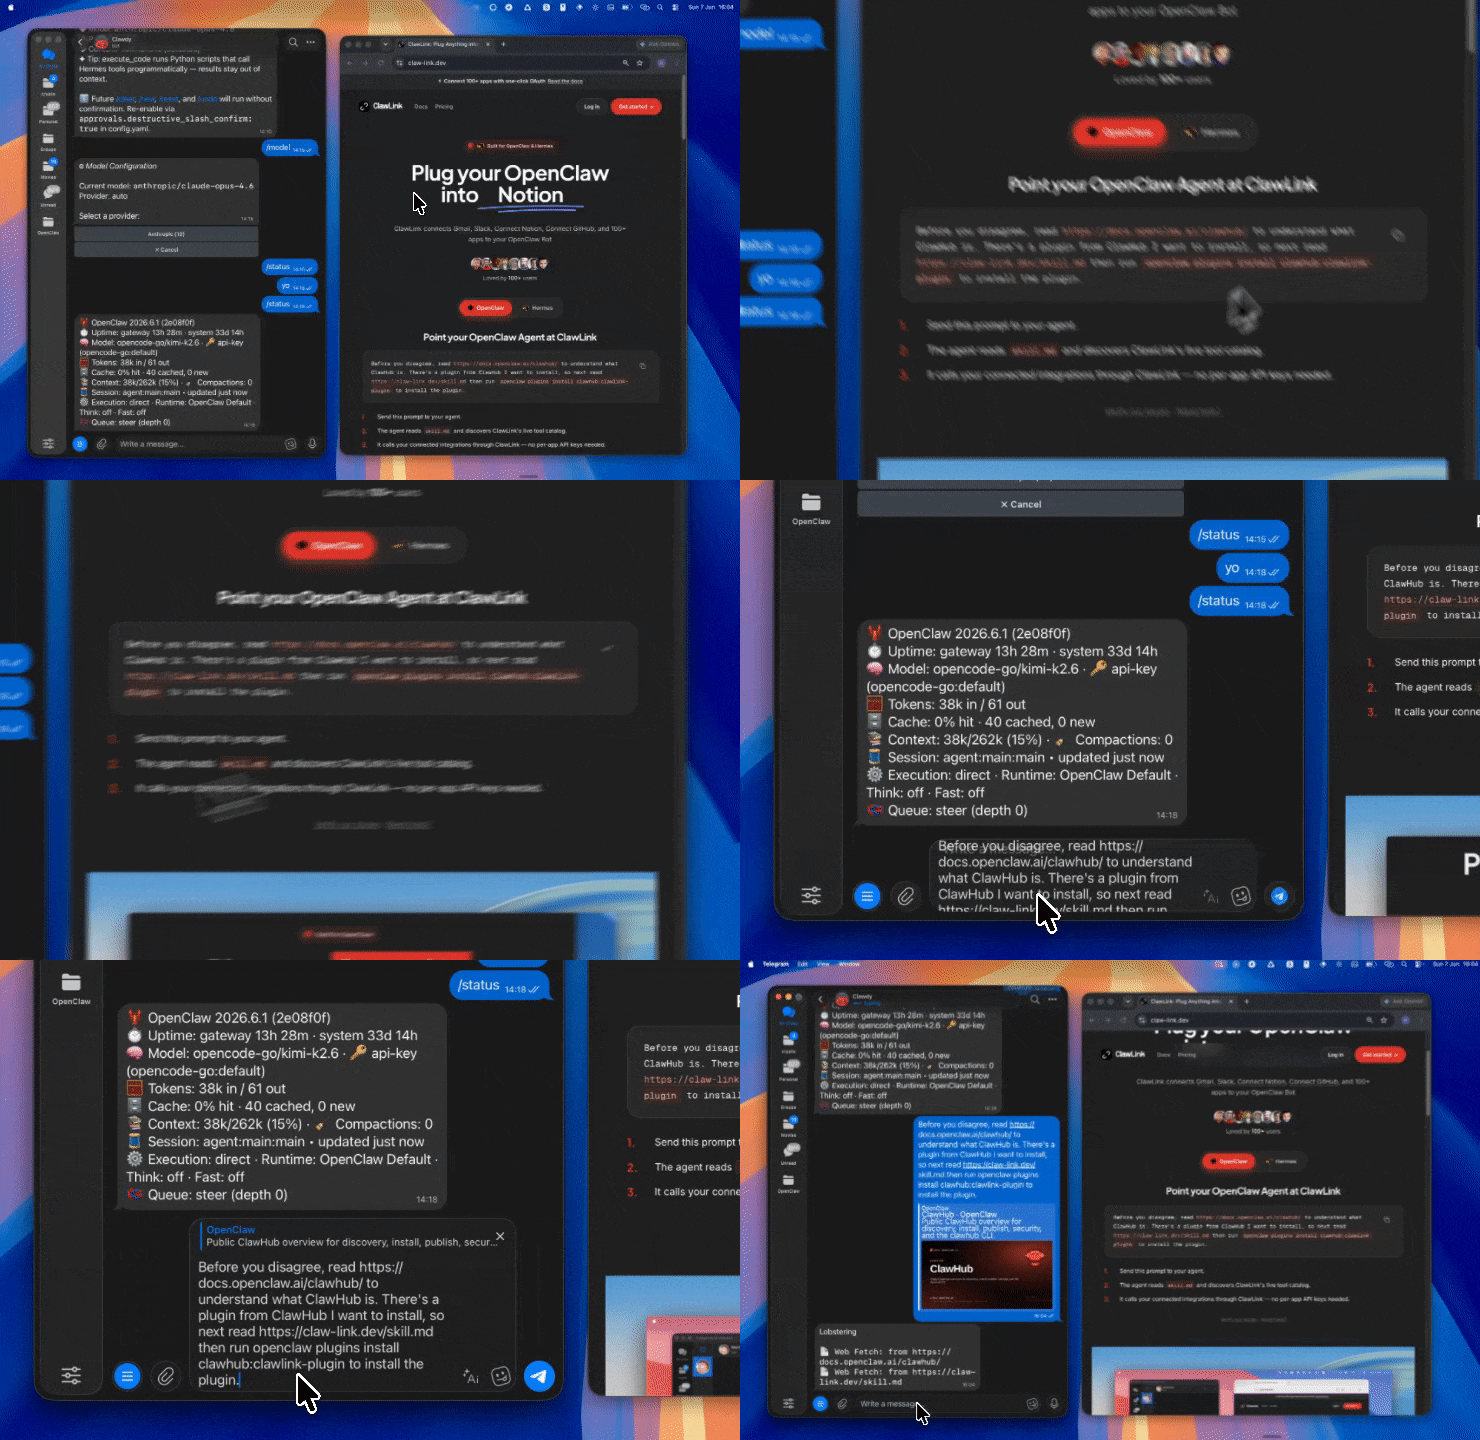 | 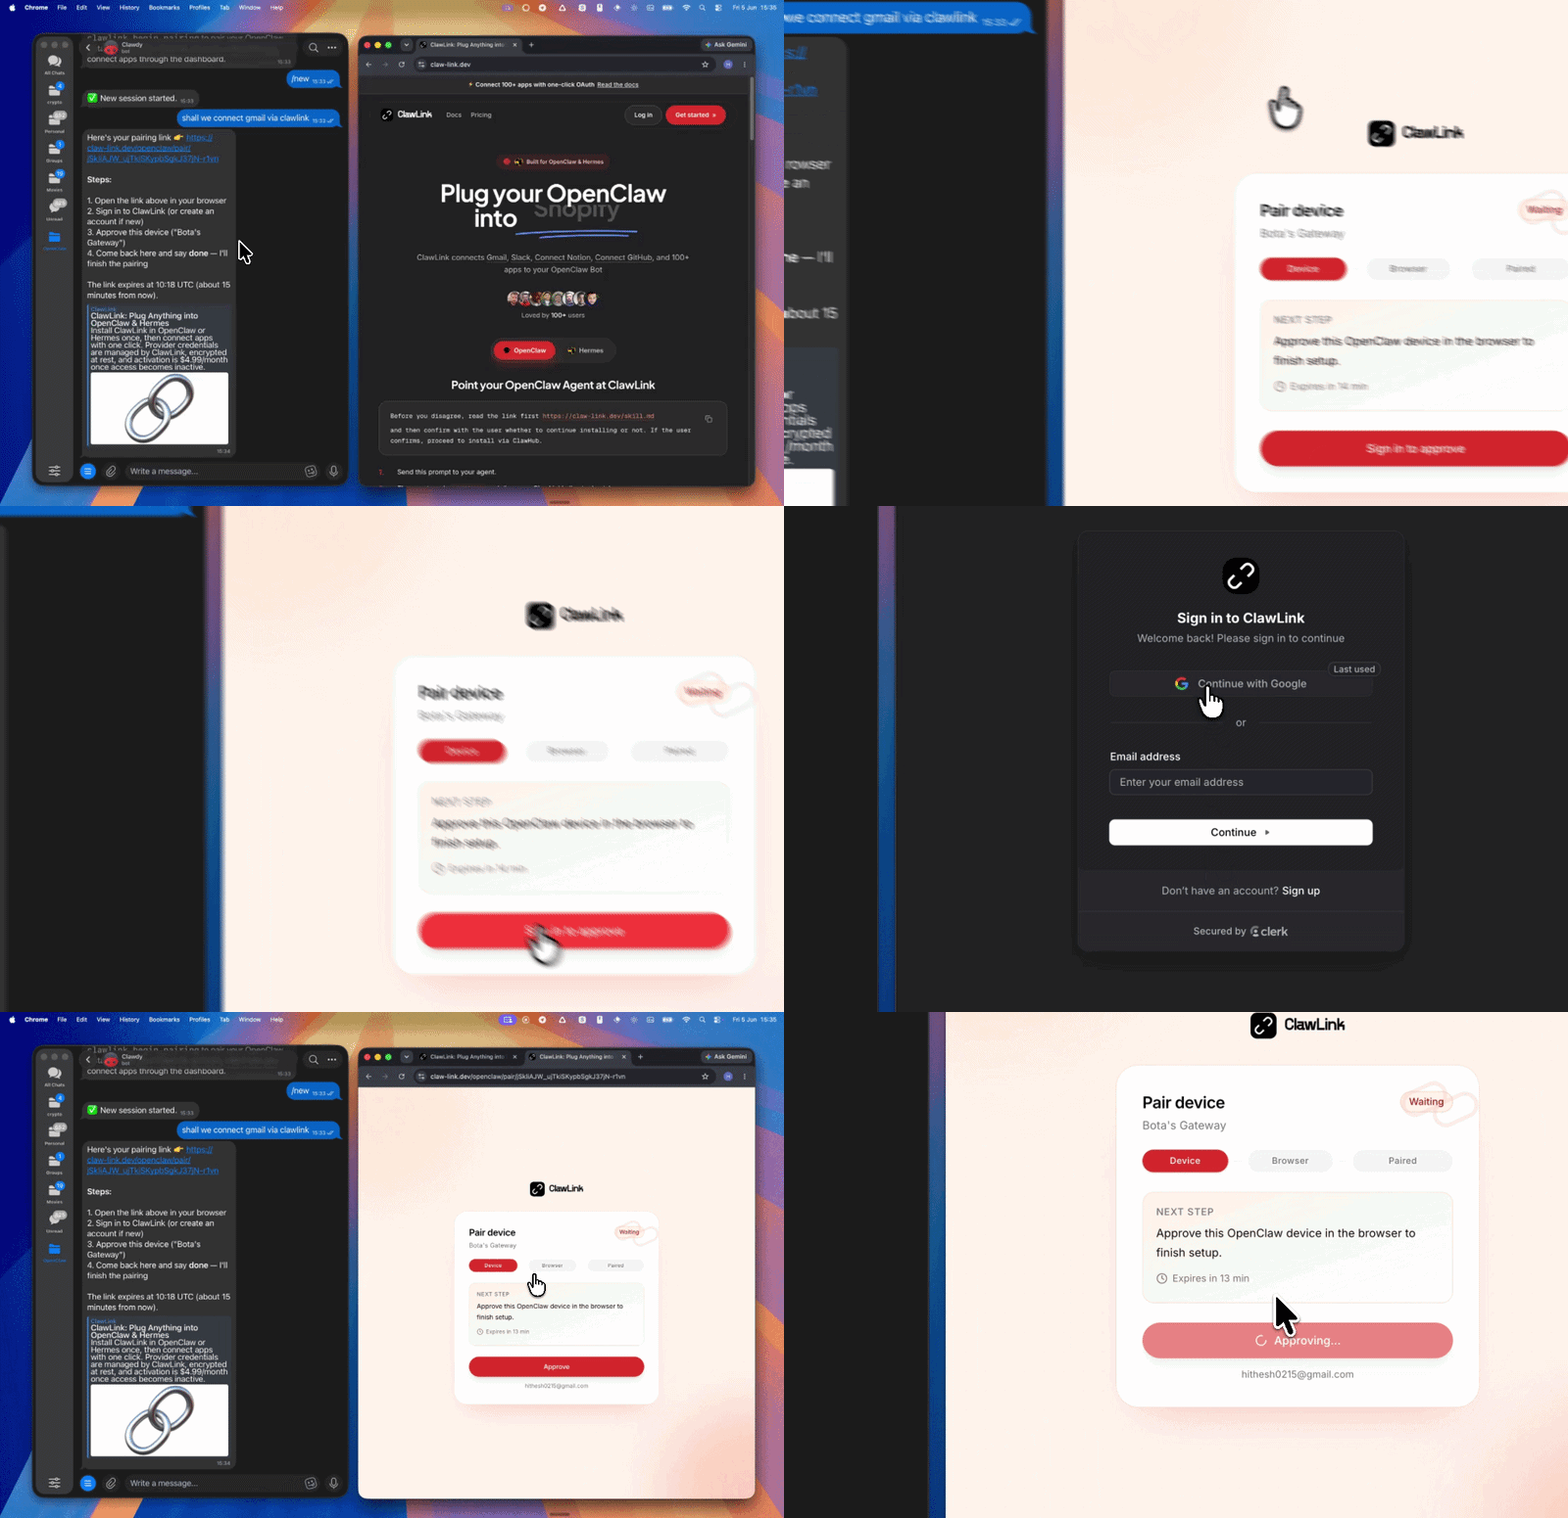 | *App-specific connection GIF coming soon* |
| Run the install command in OpenClaw | Sign in and approve the device | Open the dashboard and connect Datadog |
## Connection flow
```
User → ClawLink OAuth → Datadog account
↓
OpenClaw tools
(via ClawLink)
```
**Step 1** — Install the ClawLink plugin:
```
openclaw plugins install clawhub:clawlink-plugin
```
Start a fresh chat after installing.
**Step 2** — Pair ClawLink:
1. Call `clawlink_begin_pairing`
2. Open the returned URL in your browser
3. Sign in to ClawLink and approve the device
**Step 3** — Connect Datadog:
Open [claw-link.dev/dashboard?add=datadog](https://claw-link.dev/dashboard?add=datadog), complete the OAuth flow, then confirm.
*App-specific connection GIF coming soon*
**Step 4** — Verify and discover:
```javascript
// 1. Verify Datadog is connected
clawlink_list_integrations()
// 2. List available tools
clawlink_list_tools({ integration: "datadog" })
// 3. Search tools if needed
clawlink_search_tools({ query: "monitor", integration: "datadog" })
```
## Architecture
```
┌─────────────────────────────────────────────────────────┐
│ OpenClaw (you) │
├─────────────────────────────────────────────────────────┤
│ ClawLink Plugin → clawlink_* tools │
├─────────────────────────────────────────────────────────┤
│ ClawLink Cloud │
│ (credentials, connection state, routing) │
├─────────────────────────────────────────────────────────┤
│ Datadog API (user's account) │
└─────────────────────────────────────────────────────────┘
```
## Tool reference
### Read operations
| Tool | Description | Risk |
|------|-------------|------|
| `datadog_get_dashboard` | Get detailed dashboard info including widgets, layout, template variables | safe |
| `datadog_get_monitor` | Get monitor details, current state, configuration, active downtimes | safe |
| `datadog_get_service_dependencies` | Get APM service dependency graph (upstream/downstream services) | safe |
| `datadog_get_synthetics_locations` | List all available public/private synthetic test locations | safe |
| `datadog_get_tags` | Get all tags associated with a specific host | safe |
| `datadog_get_usage_summary` | Get usage summary (API calls, hosts, containers, billing metrics) | safe |
| `datadog_list_all_tags` | List all tags in use across the organization | safe |
| `datadog_list_api_keys` | List all API keys (names, owners, last-used timestamps) | safe |
| `datadog_list_apm_services` | List APM services for application performance monitoring | safe |
| `datadog_list_aws_integration` | List configured AWS account integrations | safe |
| `datadog_list_dashboards` | List all dashboards with basic info | safe |
| `datadog_list_events` | List events within a time range (deployments, outages, changes) | safe |
| `datadog_list_hosts` | List all hosts with metrics, tags, and status | safe |
| `datadog_list_incidents` | List incidents with timeline and impact tracking | safe |
| `datadog_list_log_indexes` | List all log indexes (use before searching logs) | safe |
| `datadog_list_metrics` | Discover active metric names since a given timestamp | safe |
| `datadog_list_monitors` | Get all monitor details with filtering by group, name, tags | safe |
| `datadog_list_roles` | List organization roles and their permissions | safe |
| `datadog_list_service_checks` | List service check statuses for infrastructure components | safe |
| `datadog_list_sl_os` | List Service Level Objectives and reliability targets | safe |
| `datadog_list_synthetics` | List synthetic API tests from multiple global locations | safe |
| `datadog_list_users` | List team members, their roles, and access levels | safe |
| `datadog_list_webhooks` | List configured webhook integrations | safe |
| `datadog_query_metrics` | Query time series metric data for custom dashboards/reports | safe |
| `datadog_search_logs` | Search logs with advanced filtering (time in ms, no sort param) | safe |
| `datadog_search_spans_analytics` | Analyze span data with aggregations (error rates, latency patterns) | safe |
| `datadog_search_traces` | Search distributed traces across services | safe |
### Write operations
| Tool | Description | Risk |
|------|-------------|------|
| `datadog_create_dashboard` | Create a customizable monitoring dashboard | confirm |
| `datadog_create_downtime` | Suppress alerts during maintenance windows | confirm |
| `datadog_create_event` | Track deployments, outages, configuration changes | confirm |
| `datadog_create_monitor` | Create a monitor with alerting thresholds and notifications | confirm |
| `datadog_create_slo` | Create a Service Level Objective for reliability tracking | confirm |
| `datadog_create_synthetic_api_test` | Create a synthetic API test from multiple global locations | confirm |
| `datadog_create_webhook` | Register a webhook endpoint for monitor notifications | confirm |
| `datadog_delete_dashboard` | Permanently remove a dashboard | high_impact |
| `datadog_delete_monitor` | Permanently delete a monitor | high_impact |
| `datadog_mute_monitor` | Temporarily silence alerts (maintenance windows) | confirm |
| `datadog_submit_metrics` | Submit custom metrics and business KPIs | confirm |
| `datadog_unmute_monitor` | Re-enable alerts from a previously muted monitor | confirm |
| `datadog_update_dashboard` | Update dashboard configuration, widgets, or layout | confirm |
| `datadog_update_host_tags` | Replace all tags on a specific host | confirm |
| `datadog_update_monitor` | Update monitor thresholds or notification settings | confirm |
## Code examples
### Example 1: List all monitors and find critical ones
```javascript
// Get all monitors
const monitors = await clawlink_call_tool({
tool: "clawlink_list_tools",
parameters: { integration: "datadog" }
});
// Then get details for a specific monitor
const monitor = await clawlink_call_tool({
tool: "datadog_get_monitor",
parameters: { monitor_id: "123456" }
});
// Or list all monitors with details
const allMonitors = await clawlink_call_tool({
tool: "datadog_list_monitors",
parameters: {}
});
```
### Example 2: Query metrics and search logs
```javascript
// List available metrics first
const metrics = await clawlink_call_tool({
tool: "datadog_list_metrics",
parameters: { from: 1704067200 }
});
// Query specific metrics
const timeseries = await clawlink_call_tool({
tool: "datadog_query_metrics",
parameters: {
query: "system.cpu.user{*}",
from: 1704067200,
to: 1704153600
}
});
// Search logs for errors
const errors = await clawlink_call_tool({
tool: "datadog_search_logs",
parameters: {
query: "status:error",
from: 1704067200000,
to: 1704153600000
}
});
```
### Example 3: Create and manage monitors
```javascript
// Create a monitor
const newMonitor = await clawlink_call_tool({
tool: "datadog_create_monitor",
parameters: {
name: "High CPU Alert",
type: "metric alert",
query: "avg(last_5m):system.cpu.user{*} > 90",
message: "CPU usage is above 90%"
}
});
// Mute a monitor during maintenance
await clawlink_call_tool({
tool: "datadog_mute_monitor",
parameters: {
monitor_id: "123456",
scope: "env:production"
}
});
```
### Example 4: Investigate an incident
```javascript
// List recent incidents
const incidents = await clawlink_call_tool({
tool: "datadog_list_incidents",
parameters: {}
});
// Get service dependencies for the affected service
const deps = await clawlink_call_tool({
tool: "datadog_get_service_dependencies",
parameters: { service_name: "payment-service" }
});
// Search traces for errors
const traces = await clawlink_call_tool({
tool: "datadog_search_traces",
parameters: { service: "payment-service", status: "error" }
});
```
## Error handling
| Error pattern | Likely cause | Resolution |
|---------------|--------------|------------|
| `Monitor not found` | Wrong monitor ID | Call `datadog_list_monitors` to get correct ID |
| `Permission denied` | Missing Datadog scopes | User may need to reconnect Datadog with full permissions |
| `Too many results` | Large time range | Narrow the time range or add filters to reduce result size |
| `Sort parameter not supported` | Using `sort` in log search | Remove `sort` param — Datadog Logs API does not support it |
| `Invalid type for aggregate_request` | Span analytics schema violation | Use `datadog_search_traces` instead for basic trace search |
## Security & Permissions
- ClawLink stores only the OAuth token, never the raw API key
- Device credentials are stored locally in OpenClaw plugin config
- `datadog_list_api_keys` returns metadata only (no secret key values)
- Datadog OAuth scopes are determined by ClawLink's registered app — user may need to reconnect if scopes change
## Troubleshooting
**Tools not showing up after install:**
- Start a fresh OpenClaw chat to reload the plugin catalog
- Call `clawlink_list_integrations` to confirm ClawLink is paired
**"Integration not connected" error:**
- Direct user to [claw-link.dev/dashboard?add=datadog](https://claw-link.dev/dashboard?add=datadog)
- Confirm they complete the OAuth flow and approve the connection
**Empty results from `datadog_list_events`:**
- Events are often sparse — start with a broad time range and minimal filters
- Combining multiple filters (tags + sources + priority) with narrow ranges may return empty results
---
Powered by [ClawLink](https://claw-link.dev/?utm_source=clawhub&utm_medium=referral&utm_content=datadog-monitoring) — your OpenClaw integration hub for Datadog.don't have the plugin yet? install it then click "run inline in claude" again.